Writing Go in Emacs (cont.)
Back in Mach I demonstrated various ways in which go-mode can help you write Go more efficiently.
Today I want to post a quick follow-up, showing two new ways to improve your performance. One is a very handy 3rd party package, while the other is a direct addition to go-mode.
go-eldoc.el 
go-eldoc.el by Syohei Yoshida implements ElDoc functionality for go-mode. For those of you who aren’t familiar with ElDoc, it’s a minor mode that uses the echo area to show the argument list of the function call you are currently writing or editing.
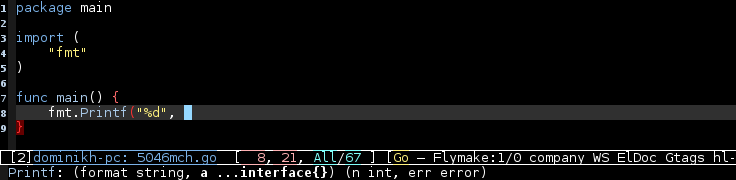
Figure 1: Screenshot of go-eldoc.el
For example, if you were typing fmt.Printf(, it would tell you that the signature of the function is Printf(format string, a ...interface{}) (n int, err error). It will also highlight the current argument in the list.
Under the hood, go-eldoc.el uses gocode to determine function signatures, which means it can make use of gocode’s well known accuracy.
Code coverage analysis 
When writing tests, one measure you continuously want to look at is code coverage. In tip, Go’s test tool supports generating coverage data for your code and provides a way to generate a single HTML file out of it, which is already a very nice way to check coverage.
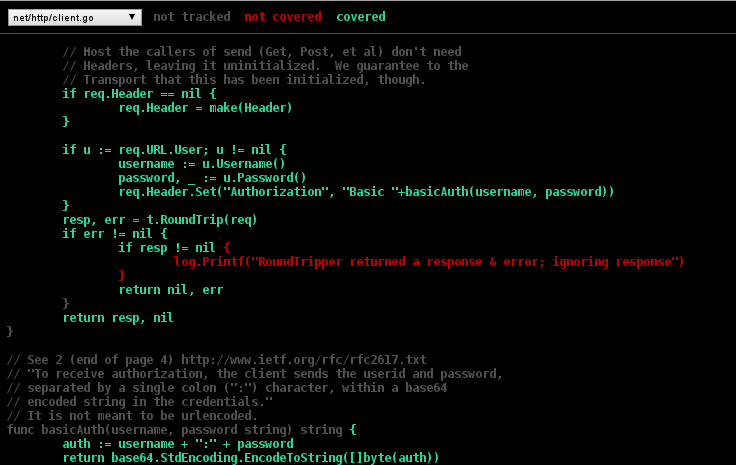
Figure 2: Screenshot of go tool coverage HTML output
But wouldn’t it be even nicer if your editor could display that information directly? In a buffer that behaves just like
a Go buffer with editing and navigation capabilities? That’s what go-mode now supports! It can parse the coverage
information that go test generates and overlay it on your code, in a second, cloned buffer. This buffer behaves just
like a normal go-mode buffer, offering the same level of navigation and editing capabilities.
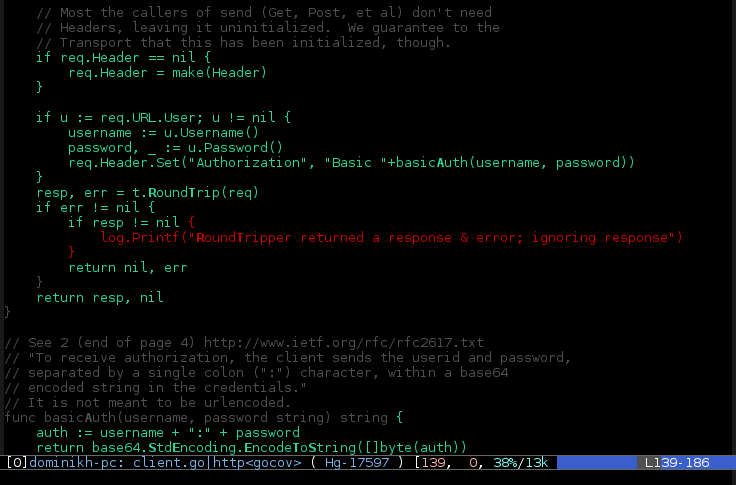
Figure 3: Screenshot of go-coverage
So how hard is it to generate and display coverage information? Not hard at all. In order to generate coverage
information, you need to pass the -coverprofile option to go test, specifying a file to print the information to. An
example invocation could look like go test -coverprofile=c.out. This can easily be done via M-x compile or a
terminal.
In order to display the information, run M-x go-coverage in the buffer you want to view the information for. It will
prompt you for the coverage file, then open a cloned buffer with a gray/red/green overlay. Gray represents untracked
code (comments, types and other code that cannot be run by itself), red represents code that wasn’t covered by your
tests and green represents code that was covered.
If you want to update the displayed information after a new run of go test, you can just use M-x go-coverage in the
coverage buffer and it will update it from the same file you used last time.
There is one more feature that go test’s coverage output supports, and that’s detailed accounting on how often a line
of code ran, instead of a boolean yes or no. To enable this, pass -covermode=count (the default is set) to go test. To display the information you still use M-x go-coverage.
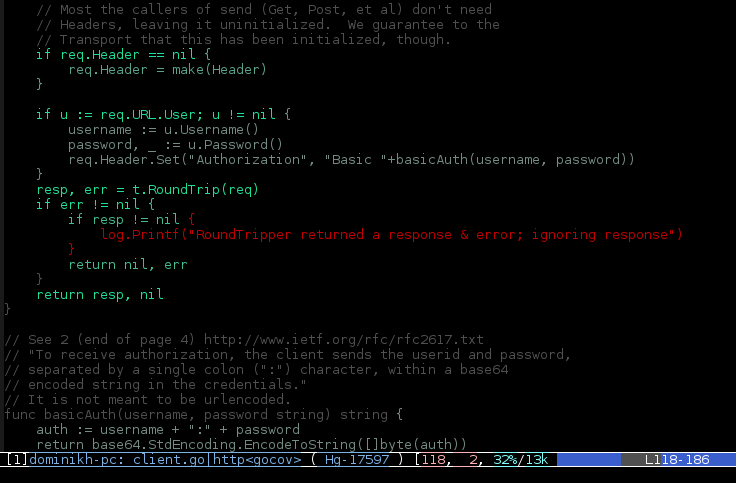
Figure 4: Screenshot of go-coverage with gradient
The brighter the green is, the more often the code has been run. Hovering over any of the lines will give you a tooltip with the absolute number of times.
It is important to note that you need Go tip for this to work. Go 1.1 does not include coverage generation yet. And, as usual, it’s best to use go-mode.el from GitHub, even though the latest changes are slowly finding their way upstream.