An incomplete list of Go tools
Go is an amazing language, but not just because of its language features, but also because of its ecosystem and how easy it is to write tools that operate on Go code.
While languages and frameworks like Java and .NET have popular IDEs (e.g. Eclipse and Visual Studio) that can do formatting, refactoring, code generation etc, the Go ecosystem focuses on small standalone tools and reusable parsers. While Eclipse’s features are locked into that IDE, a huge and clunky piece of software, Go has tools like gofmt that can be used from the command line or any editor that allows calling external programs. Write a tool once, and everyone gets to use it. It doesn’t matter if you use acme, vim, Emacs or Sublime Text, you can benefit from a vast number of tools.
This article presents an incomplete list of official and 3rd party tools for working with Go – it’s inherently incomplete, as people keep writing new tools at a steady pace. Furthermore, not everyone may like every tool on this list. Some tools serve very specific needs, some are very opinionated and some are controversial.
The following index is sorted alphabetically for ease of use, but the article itself is sorted by theme for a nicer reading experience.
- benchcmp
- benchviz
- errcheck
- Generics
- go generate
- go tool cover
- go vet
- gocode
- godef
- godepgraph
- gofmt
- goimports
- golint
- gorename
- goreturns
- impl
- oracle
- prettybench
- stringer
gofmt 
Hopefully you know gofmt by now, but if you don’t: Run gofmt on your Go code, and it formats your code according to
the only acceptable way of formatting it. That’s it.
go vet 
Go comes with its own linter, go vet, for analysing Go code and finding common mistakes. So far, it can check your
code for the following mistakes:
- Useless assignments
- Common mistakes when using sync/atomic
- Invalid
+buildtags - Using composite literals without keyed fields
- Passing locks by value
- Comparing functions with nil
- Using wrong printf format specifiers
- Closing over loop variables the wrong way
- Struct tags that do not follow the canonical format
- Unreachable code
- Misuse of
unsafe.Pointer - Mistakes involving boolean operators
The following (constructed) piece of code tries to trigger as many errors as possible, to show go vet’s behaviour:
package main

import (
    "crypto/tls"
    "fmt"
    "sync"
    "sync/atomic"
    "unsafe"
)

// +build this,is,too,late

type T struct {
    A int `not a canonical tag`
}

func foo() []byte       { return []byte{} }
func bar(mu sync.Mutex) {} // Locks have to be passed as pointers

func main() {
    fmt.Sprintf("%s", 1) // Wrong verb
    fmt.Sprint("%s", 1)  // Wrong method

    var a int
    a = a // Useless assignment

    _ = tls.Certificate{nil, nil, nil, nil} // These fields should be keyed

    if foo != nil { // We meant to check foo() != nil
    }

    x := uintptr(0)
    _ = unsafe.Pointer(x) // Misuse of unsafe.Pointer

    for _, x := range []int{1, 2, 3} {
        go func() {
            fmt.Println(x) // Closing over x wrong, will probably produce "3 3 3"
        }()
    }

    var b int32
    b = atomic.AddInt32(&b, 1) // We shouldn't assign to b

    var c bool
    if c == false && c == true { // Always false
    }

    if c || c { // Redundant
    }

    return
    fmt.Println("unreachable") // Unreachable code
}
And go vet’s opinion of our code:
/tmp/vet.go:11: +build comment must appear before package clause and be followed by a blank line
/tmp/vet.go:14: struct field tag `not a canonical tag` not compatible with reflect.StructTag.Get
/tmp/vet.go:18: bar passes Lock by value: sync.Mutex
/tmp/vet.go:52: unreachable code
/tmp/vet.go:21: arg 1 for printf verb %s of wrong type: int
/tmp/vet.go:22: possible formatting directive in Sprint call
/tmp/vet.go:25: self-assignment of a to a
/tmp/vet.go:27: crypto/tls.Certificate composite literal uses unkeyed fields
/tmp/vet.go:29: comparison of function foo != nil is always true
/tmp/vet.go:33: possible misuse of unsafe.Pointer
/tmp/vet.go:37: range variable x captured by func literal
/tmp/vet.go:42: direct assignment to atomic value
/tmp/vet.go:45: suspect and: c == false && c == true
/tmp/vet.go:48: redundant or: c || c
golint 
Install with go get github.com/golang/lint/golint
While go vet checks your code for actual programming errors, golint checks your code for style violations (so it’s not
really a linter – naming things is hard.)
Gofmt already takes care of whitespace-related style questions, but it cannot cover things such as variable names. Golint follows the style that is used internally by Google, which is generally accepted by the open source Go community as well – in essence it checks the various style questions discussed in the wiki.
Golint does not emit errors or warnings, but “suggestions”: These suggestions can be wrong at times, and code that golint complains about isn’t necessarily wrong – it might just be hitting a false positive. Nevertheless, it’s more often right than wrong, and you should definitely run golint on your code from time to time and fix those suggestions that it is right about.
The amount of style violations golint checks for is a bit longer than the list of modules go vet has, so what follows
is only a demonstration of golint’s checks, it’s not exhaustive. For the following piece of code
package lint

import (
    "errors"
    . "fmt"
)

var SomeError = errors.New("Capitalised error message")

type unexported int
type Exported int

func (this unexported) Foo() {}

func (oneName Exported) Foo() {
}

func (anotherName Exported) Bar() {
    Println("Hi")
}
golint has the following suggestions:
/tmp/lint.go:5:2: should not use dot imports
/tmp/lint.go:8:5: exported var SomeError should have comment or be unexported
/tmp/lint.go:11:6: exported type Exported should have comment or be unexported
/tmp/lint.go:15:1: exported method Exported.Foo should have comment or be unexported
/tmp/lint.go:18:1: exported method Exported.Bar should have comment or be unexported
/tmp/lint.go:8:5: error var SomeError should have name of the form ErrFoo
/tmp/lint.go:13:1: receiver name should be a reflection of its identity; don't use generic names such as "me", "this", or "self"
/tmp/lint.go:18:1: receiver name anotherName should be consistent with previous receiver name oneName for Exported
errcheck 
Install with go get github.com/kisielk/errcheck
Ignoring errors in Go is more difficult than ignoring exceptions in some other languages, but it’s not impossible. Some
people even say that it’s way too easy. Call a function like (*os.File).Close without looking at its return value, and
that’s an error gone by unnoticed.
The errcheck tool has been written to help you find exactly those function calls. Running errcheck on a package will report all function calls that have unchecked errors.
The following code has three unchecked errors, one for each method call:
package main

import "os"

func main() {
    f, _ := os.Open("foo")
    f.Write([]byte("Hello, world."))
    f.Close()
}
Running errcheck with the default options on it will produce the following output:
foo/foo.go:7:9	f.Write([]byte("Hello, world."))
foo/foo.go:8:9	f.Close()
Do note that it is not printing the call to os.Open – that’s because assignment to _ is not interpreted as
“unchecked” by default. That’s because assigning errors to _ can be a valid pattern, for when one truly doesn’t care
about an error, or because it’s known that an error cannot occur (that’s true for some implementations of the io.Writer
interface, for example). If you do worry about someone assigning to _ out of laziness, you can run errcheck with the
-blank flag:
foo/foo.go:6:5	f, _ := os.Open("foo")
foo/foo.go:7:9	f.Write([]byte("Hello, world."))
foo/foo.go:8:9	f.Close()
Furthermore, errcheck comes with options for ignoring certain packages or functions, to avoid false positives. Together
with go vet, it should be part of your quality assurance scripts.
go tool cover 
Go 1.2 added support for generating code coverage reports, and while there’s an excellent blog post titled “The cover story”, it might not be receiving enough attention.
Code coverage reports provide a quick and easy way of finding untested code. Go’s support for these reports consists of
two components: Support in go test for generating coverage profiles and go tool cover to generate reports from it.
Set the -coverprofile option while running go test and it will generate a coverage profile. You can then pass the
profile to go tool cover and generate different kinds of reports. Currently, there are two forms of reports: A
per-function listing of code coverage, and an HTML report that renders your code in a color-coded fashion, showing
covered lines of code in green, uncovered lines in red, and irrelevant lines (such as comments, type definitions, etc)
in grey.
fmt/format.go:	init			100.0%
fmt/format.go:	clearflags		100.0%
fmt/format.go:	init			100.0%
fmt/format.go:	computePadding		84.6%
fmt/format.go:	writePadding		100.0%
fmt/format.go:	pad			100.0%
fmt/format.go:	padString		100.0%
fmt/format.go:	fmt_boolean		100.0%
fmt/format.go:	integer			100.0%
fmt/format.go:	truncate		100.0%
fmt/format.go:	fmt_s			100.0%
fmt/format.go:	fmt_sbx			100.0%
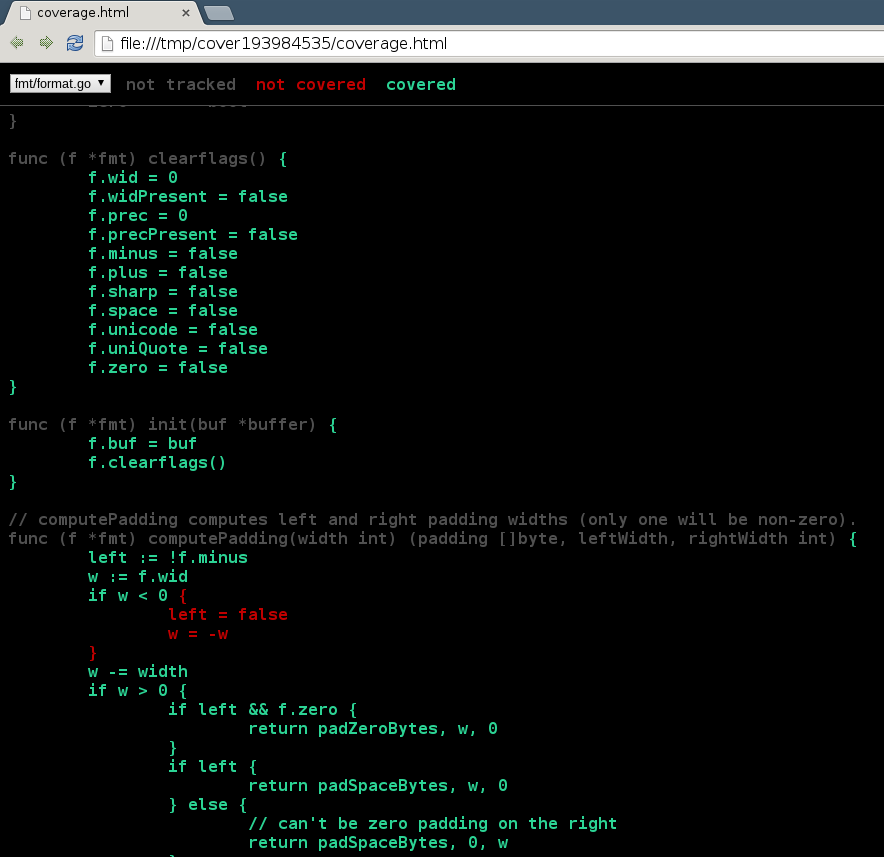
Figure 1: go tool cover in the browser
Because the generation of a profile and actually using it are separated, one can also use other tools than go tool cover to interpret profiles. Vim and Emacs have support for Go’s coverage profiles, and so does GoConvey.
[[./static/img/go_tools/cover.emacs.png
benchcmp 
Install with go get golang.org/x/tools/cmd/benchcmp
Benchmarks are a crucial tool when optimizing code. Anyone who has asked “Is A or B faster?” will have (or should have!)
heard an answer along the lines of “Write a benchmark!”. Go’s testing package has built-in benchmarking facilities
that produce useful statistics about speed and allocations.
Comparing numbers by hand, however, can be tedious, and usually we’re interested in relative changes: Is my new version
faster, and by how much? The benchcmp tool can answer this question. It takes two text files as input, the output of go test -bench for the old and new version of your code, and outputs a delta, measured in per cent, for each benchmark.
The following output is the result of running the benchmarks for the image/png package in Go 1.3 and Go 1.4 and
running the output through benchcmp:
benchmark                        old ns/op     new ns/op     delta
BenchmarkPaeth                   5.22          5.30          +1.53%
BenchmarkDecodeGray              1037540       1018369       -1.85%
BenchmarkDecodeNRGBAGradient     4391776       3838947       -12.59%
BenchmarkDecodeNRGBAOpaque       3148985       3145987       -0.10%
BenchmarkDecodePaletted          747152        803097        +7.49%
BenchmarkDecodeRGB               2861484       2751671       -3.84%
BenchmarkEncodeGray              3912599       3940407       +0.71%
BenchmarkEncodeNRGBOpaque        12066176      12072256      +0.05%
BenchmarkEncodeNRGBA             13863837      13898732      +0.25%
BenchmarkEncodePaletted          3908491       3939133       +0.78%
BenchmarkEncodeRGBOpaque         12021250      12040434      +0.16%
BenchmarkEncodeRGBA              33623263      48841059      +45.26%

benchmark                        old MB/s     new MB/s     speedup
BenchmarkDecodeGray              63.16        64.35        1.02x
BenchmarkDecodeNRGBAGradient     59.69        68.29        1.14x
BenchmarkDecodeNRGBAOpaque       83.25        83.33        1.00x
BenchmarkDecodePaletted          87.71        81.60        0.93x
BenchmarkDecodeRGB               91.61        95.27        1.04x
BenchmarkEncodeGray              78.52        77.96        0.99x
BenchmarkEncodeNRGBOpaque        101.84       101.79       1.00x
BenchmarkEncodeNRGBA             88.63        88.41        1.00x
BenchmarkEncodePaletted          78.60        77.99        0.99x
BenchmarkEncodeRGBOpaque         102.22       102.06       1.00x
BenchmarkEncodeRGBA              36.55        25.16        0.69x
We can easily see that most functions didn’t have significant changes in speed, but BenchmarkEncodeRGBA sticks out, as
its performance has nearly halved in Go 1.4.
If your benchmarks don’t produce stable output, maybe because your system isn’t entirely idle, or because your CPU is
applying thermal throttling of some sort, you can repeat a single benchmark multiple times and tell benchcmp to pick the
best result, by passing the -best option. You can also omit any results that are the same between the two versions,
and sort results by magnitude of change.
benchcmp used to be written in Perl and was part of the Go distribution, but it has since been rewritten in Go and must be installed separately.
prettybench 
Install with go get github.com/cespare/prettybench
While we’re on the topic of benchmarks, let’s mention prettybench, a small utility that makes the output of go test -bench a bit nicer, by correctly aligning all columns and printing column headers. Simply pipe go test’s output
through prettybench. The downside of using prettybench, however, is that it has to buffer output, so you won’t see any
results until all benchmarks have finished running.
Before:
PASS
BenchmarkCSSEscaper	 1000000	      2843 ns/op
BenchmarkCSSEscaperNoSpecials	 5000000	       671 ns/op
BenchmarkDecodeCSS	 1000000	      1183 ns/op
BenchmarkDecodeCSSNoSpecials	50000000	        32 ns/op
BenchmarkCSSValueFilter	 5000000	       501 ns/op
BenchmarkCSSValueFilterOk	 5000000	       707 ns/op
BenchmarkEscapedExecute	  500000	      6191 ns/op
BenchmarkHTMLNospaceEscaper	 1000000	      2523 ns/op
BenchmarkHTMLNospaceEscaperNoSpecials	 5000000	       596 ns/op
BenchmarkStripTags	 1000000	      2351 ns/op
BenchmarkStripTagsNoSpecials	10000000	       260 ns/op
BenchmarkJSValEscaperWithNum	 1000000	      1123 ns/op
BenchmarkJSValEscaperWithStr	  500000	      4882 ns/op
BenchmarkJSValEscaperWithStrNoSpecials	 1000000	      1461 ns/op
BenchmarkJSValEscaperWithObj	  500000	      5052 ns/op
BenchmarkJSValEscaperWithObjNoSpecials	 1000000	      1897 ns/op
BenchmarkJSStrEscaperNoSpecials	 5000000	       608 ns/op
BenchmarkJSStrEscaper	 1000000	      2633 ns/op
BenchmarkJSRegexpEscaperNoSpecials	 5000000	       661 ns/op
BenchmarkJSRegexpEscaper	 1000000	      2510 ns/op
BenchmarkURLEscaper	  500000	      4424 ns/op
BenchmarkURLEscaperNoSpecials	 5000000	       422 ns/op
BenchmarkURLNormalizer	  500000	      3068 ns/op
BenchmarkURLNormalizerNoSpecials	 5000000	       431 ns/op
ok  	html/template	62.874s
After:
PASS
benchmark                                    iter    time/iter
---------                                    ----    ---------
BenchmarkCSSEscaper                       1000000   2843 ns/op
BenchmarkCSSEscaperNoSpecials             5000000    671 ns/op
BenchmarkDecodeCSS                        1000000   1183 ns/op
BenchmarkDecodeCSSNoSpecials             50000000     32 ns/op
BenchmarkCSSValueFilter                   5000000    501 ns/op
BenchmarkCSSValueFilterOk                 5000000    707 ns/op
BenchmarkEscapedExecute                    500000   6191 ns/op
BenchmarkHTMLNospaceEscaper               1000000   2523 ns/op
BenchmarkHTMLNospaceEscaperNoSpecials     5000000    596 ns/op
BenchmarkStripTags                        1000000   2351 ns/op
BenchmarkStripTagsNoSpecials             10000000    260 ns/op
BenchmarkJSValEscaperWithNum              1000000   1123 ns/op
BenchmarkJSValEscaperWithStr               500000   4882 ns/op
BenchmarkJSValEscaperWithStrNoSpecials    1000000   1461 ns/op
BenchmarkJSValEscaperWithObj               500000   5052 ns/op
BenchmarkJSValEscaperWithObjNoSpecials    1000000   1897 ns/op
BenchmarkJSStrEscaperNoSpecials           5000000    608 ns/op
BenchmarkJSStrEscaper                     1000000   2633 ns/op
BenchmarkJSRegexpEscaperNoSpecials        5000000    661 ns/op
BenchmarkJSRegexpEscaper                  1000000   2510 ns/op
BenchmarkURLEscaper                        500000   4424 ns/op
BenchmarkURLEscaperNoSpecials             5000000    422 ns/op
BenchmarkURLNormalizer                     500000   3068 ns/op
BenchmarkURLNormalizerNoSpecials          5000000    431 ns/op
ok  	html/template	62.874s
benchviz 
Install with go get github.com/ajstarks/svgo/benchviz
Another way of visualising benchmark results is via benchviz, a tool that generates graphical output. It depends on
benchcmp and uses bar charts to show positive and negative change. Simply pipe the output of benchcmp to benchviz
and it will produce SVG output on stdout. Running benchviz -h will reveal several settings that can control the way
the image will look like.
By default, it will look similar to the following image.

Figure 3: benchviz output for the benchmarks from earlier
go generate 
A new subcommand that was added in Go 1.4 is go generate, which is supposed to replace various uses of makefiles and
shell scripts in Go packages.
All go generate does is look for directives (in the form of special comments) in your Go code that direct it to
execute programs. These programs usually generate new Go files, hence the name.
Example uses of go generate include running yacc to turn grammar files into Go code, generating Go code from protobuff
definitions or embedding binary files in Go programs.
A core principle of go generate is that it has to be run manually and is supposed to be run by the developer of the
package. It will not run on go build, and by extension not on go get, either. A developer is supposed to run go generate and then check the generated files into version control. That way, when a user downloads the package, he
already has all the Go files he needs to compile it and doesn’t need to run arbitrary tools (which would also be a major
security risk.)
What go generate explicitly is not is a general build system à la make – it does not offer any form of dependency
analysis and instead simply runs commands it encounters in the order it finds them.
For a detailed description on how to use go generate, run go generate -h.
stringer 
Install with go get golang.org/x/tools/cmd/stringer
Constants in Go are a compile-time concept. Once compilation finishes and you run your program, code isn’t aware of
constants or their names anymore. But what if you have a set of typed constants and want to implement the Stringer
interface for them? In the past, the easiest solutions were using a switch, or having a slice or map of names. Writing
it felt a bit silly (why do I need to write each word as a constant name and as a string?) and you had to remember to
update it after adding a new constant.
With the new go generate command in Go 1.4, and the stringer tool, however, we can easily automate
this.
Given something like
package date

type Day int

const (
    Monday Day = iota
    Tuesday
    Wednesday
    Thursday
    Friday
    Saturday
    Sunday
)
running stringer -type Day on it will create a new file (day_string.go) that looks like
// generated by stringer -type Day; DO NOT EDIT

package date

import "fmt"

const _Day_name = "MondayTuesdayWednesdayThursdayFridaySaturdaySunday"

var _Day_index = [...]uint8{6, 13, 22, 30, 36, 44, 50}

func (i Day) String() string {
    if i < 0 || i >= Day(len(_Day_index)) {
        return fmt.Sprintf("Day(%d)", i)
    }
    hi := _Day_index[i]
    lo := uint8(0)
    if i > 0 {
        lo = _Day_index[i-1]
    }
    return _Day_name[lo:hi]
}
Not only is this process fully automatic, it also generates a more efficient implementation than a human would write. The specific implementation that is used depends on the number and density of your constants.
Add
//go:generate stringer -type Day
to your .go file (the one containing the constants), and every time
you run go generate, the Stringer implementation will be
regenerated for you.
impl 
Install with go get github.com/josharian/impl
Another tool that’s inspired by an IDE feature is impl, which, given an interface, will create method stubs for implementing that interface.
Now, interfaces in Go are usually small, often only consisting of one or two methods, so impl isn’t as badly needed as stub generators in e.g. Java, but it can still provide a small speedup if integrated with your editor. It’s probably mostly useful when writing tests and wanting to stub out multiple interfaces. Here, impl allows you to generate stub implementations for all interfaces with only a few keystrokes.
Generics 
It is impossible to have a tool like go generate and not have people write tools to imitate generics. It is equally
impossible to write a list of Go tools without people mentioning their favourite tool for imitating generics. As there
are as many tools for this problem as there are different interpretations of what generics really are, there’s little
point in listing all of them individually. If you’re interested in imitating generics/code generation in Go, you might
want to look at one of the following tools:
All of these tools put their own spin on the code generation problem, so it’s up to you to find out which one you like the most.
goimports 
Install with go get golang.org/x/tools/cmd/goimports
Does ./foo.go:3: imported and not used: "log" make you twitch? Do you wish Go would just allow you to import unused
packages? Or are you even tired of having to manually import all those packages you use? Then goimports might be for
you. It’s a drop-in replacement for gofmt that, additionally to formatting your code, also manages your imports for you.
It removes unused imports and adds missing imports, as long as doing so is not ambiguous. If multiple packages with the
same name, such as text/template and html/template can be used to make the code compile, then goimports errs on the
side of safety and imports neither. But that’s a rare occurrence in everyday code. More often than not, package names
are sufficiently unique, especially because goimports takes into account which identifiers you use.
Before:
package main

func main() {
    f, _ := os.Open("foo")
    log.Println("opened file")
    io.Copy(os.Stdout, f)
}
After:
package main

import (
    "io"
    "log"
    "os"
)

func main() {
    f, _ := os.Open("foo")
    log.Println("opened file")
    io.Copy(os.Stdout, f)
}
Since it’s a drop-in replacement for gofmt, all editors that permit changing the gofmt executable can use goimports.
goreturns 
Install with go get sourcegraph.com/sqs/goreturns
Inspired by the way goimports magically fixes incomplete code by adding import statements, goreturns fills in incomplete return statements with zero values.
Given the following snippet
func F() (*MyType, int, error) { return errors.New("foo") }
running goreturns on it will transform it into
func F() (*MyType, int, error) { return nil, 0, errors.New("foo") }
The primary idea here is that returning errors usually also requires returning one or more zero values, and if there are several error conditions on which to return, it can become annoying to manually write those zero values over and over again.
Goreturns acts as a drop-in replacement for goimports, by calling goimports after it’s done doing its own thing.
The following 30 seconds long screencast shows goreturns in action.
godef 
Install with go get code.google.com/p/rog-go/exp/cmd/godef
One of those features that a lot of IDE users love, and why people coming from languages like Java often ask for a “Go IDE”, is “go to definition” – being able to jump to the definition of constants, variables and functions.
Luckily, godef has us covered. Its most interesting mode of operation allows printing the file/line number in which a given identifier is defined. Given that information, it’s trivial to implement a “go to” feature in any modern editor. Support for acme is included with godef itself, vim and Emacs have support in vim-godef and go-mode respectively.
Another mode that godef supports is printing information about an identifier. Given a variable of some struct type, godef can list all fields of that struct. Given a constant, it can show you the constant’s value.
Godef works across all packages in your GOPATH as well as your GOROOT (i.e. the standard library), so any identifier you have, you can check out its code. This is a crucial feature while reading or even debugging someone else’s code. Even traversing deep into the standard library is no problem. And to make things even better, godef is so fast that the moment you decide to jump somewhere, you’re already there.
The following short clip shows godef in action:
gocode 
Install with go get github.com/nsf/gocode
Another popular feature of IDEs is auto completion. And as with most popular IDE features, the Go community came up with a reusable tool for it: gocode. Gocode provides context-sensitive auto completion and uses a client/server architecture, where the server is a caching daemon, and the clients are a command line utility as well as all popular editors.
It uses Go object files (that is, go install’d packages) to complete identifiers of imported packages, and parses the
source of the current package to provide completion for said package. Due to the efficient layout of Go object files,
the fast parser and gocode’s caching, auto completion completes almost instantly (compared to auto completion in a
popular Java IDE, which may remind you that Java is also a brand of coffee and you’d really like one now.)
Do note that gocode itself just provides information about identifiers – how your tools or editors make use of it is up to you – Emacs, for example, has several traditional completion backends, but also eldoc integration, to show the signature of the function call at point in a status bar.
oracle 
Install with go get golang.org/x/tools/cmd/oracle
The Go oracle is a source analysis tool capable of answering a multitude of questions about Go programs, such as:
- What is the type of this expression? What are its methods?
- What’s the value of this constant expression?
- Where is the definition of this identifier?
- What are the exported members of this imported package?
- What are the free variables of the selected block of code?
- What interfaces does this type satisfy?
- Which concrete types implement this interface?
- What are the possible concrete types of this interface value?
- What are the possible callees of this dynamic call?
- What are the possible callers of this function?
- What objects might this pointer point to?
- Where are the corresponding sends/receives of this channel receive/send?
- Which statements could update this field/local/global/map/array/etc?
- Which functions might be called indirectly from this one?
If one were to address the technical aspects of the Oracle, one could mention that it uses pointer analysis on an SSA form of Go programs to approximate an answer to these questions, and if you want to know more about the design of the Oracle, there is an in-depth design document – but for the sake of keeping it simple, and because I can’t possibly represent the design in an accurate way, we’ll refer to what the Oracle is doing as “magic”.
We do, however, need to peek behind the curtain a bit and explain what is necessary for the magic to work. In order to
answer most questions, the Oracle needs to trace all possible program flows. For this, it needs both a scope and
entry points. The scope defines the set of files or packages it considers during its analysis. The entry points can
either be main packages or tests – the Oracle will trace the program flow from these entry points, and the union of
all flows is what it will use to answer questions.
This is why the Oracle is able to answer questions such as Who is calling this function? – because it saw who was calling it. If no entry point leads to the call of said function, it has no callers. If no entry point leads to a channel operation on a given channel, no operations will be listed, and so on.
To demonstrate some of the coolest features of the Oracle, we’ll be asking the following questions:
- What channel operations are happening for a given channel?
- What concrete methods will a dynamic method call invoke?
- Who is calling our function?
Channel peers 
For our first question, we’ll look at the following piece of code:
package main

import "fmt"

func odd(ch chan int) {
    i := 1
    for {
        ch <- i
        i += 2
    }
}

func even(ch chan int) {
    i := 0
    for {
        ch <- i
        i += 2
    }
}

func main() {
    ch := make(chan int)
    go odd(ch)
    go even(ch)

    for i := 0; i < 10; i++ {
        fmt.Println(<-ch)
    }
}
Specifically, we’ll look at the channel receive operation in fmt.Println(<-ch), and we will inquire who is sending us
values on that channel. Executing the corresponding query will result in the following output:
$ oracle -pos="/tmp/demo2.go:#263" peers  /tmp/demo2.go
/tmp/demo2.go:27:15: This channel of type chan int may be:
/tmp/demo2.go:22:12: 	allocated here
/tmp/demo2.go:8:6: 	sent to, here
/tmp/demo2.go:16:6: 	sent to, here
/tmp/demo2.go:27:15: 	received from, here
It tells us everything there is to know about ch: Where it was created, where it is being sent to, and where it is
being received from. The interesting thing here is that the Oracle is able to tell that we’re passing ch to two
functions, odd and even, and that these functions are sending to ch. If we remove one of the goroutines, the
corresponding send operation will disappear from the output, too.
In big, highly concurrent programs, it might not always be obvious where we’re receiving a value from or where it is
being sent to, so being able to ask this kind of question can be very valuable. A common example would be a quit
channel that can be closed in many different places, and received from in multiple places as well.
Callees 
For our second question (What method are we calling?) we’ll be using the following small program:
package main

import (
    "fmt"
    "math/rand"
    "time"
)

type A struct{}
type B struct{}

func (A) String() string { return "A" }
func (B) String() string { return "B" }

func Print(s fmt.Stringer) {
    fmt.Println("Hello " + s.String())
}

func main() {
    rand.Seed(time.Now().UnixNano())
    if rand.Intn(2) == 1 {
        Print(A{})
    } else {
        Print(B{})
    }
}
We’ll look at the Print function and ask what concrete methods we might be calling when calling s.String():
$ oracle -pos="/tmp/demo.go:#227" callees  /tmp/demo.go
/tmp/demo.go:16:33: this dynamic method call dispatches to:
/tmp/demo.go:12:10: 	(main.A).String
/tmp/demo.go:13:10: 	(main.B).String
The Oracle knows which types we might end up passing to Print. If we had more calls to Print with even more types,
these would be listed as well.
Callers 
For our final question (Who is calling this method?), we’ll be reusing the program from the previous question, looking
at A.String instead and asking who might be calling this method:
$ oracle -pos="/tmp/demo.go:#116" callers  /tmp/demo.go
/tmp/demo.go:12:10: (main.A).String is called from these 1 sites:
/tmp/demo.go:16:33: 	dynamic method call from main.Print
The same information that allows the Oracle to tell which methods we’re calling also allows it to tell where a method ends up being called from, even if these calls are dynamic.
Editor integration 
The Oracle isn’t really meant to be used from the command line. Instead, it’s supposed to be used as the universal solution to Go source analysis in editors. The Oracle can generate output in plain text, JSON or XML, which should cater to most editor’s needs. It comes with Emacs integration, Vim has support for it via vim-go. And if your editor of choice isn’t offering integration with the Oracle yet, there’s also Pythia, a browser-based solution.
For more information about the Oracle’s features and how to use it, check out the user guide.
gorename 
Install with go get golang.org/x/tools/cmd/gorename
Renaming identifiers can range in difficulty from very easy to oh god why… – unless you’re using gorename, a relatively new tool for type-aware renaming of identifiers – that is constants, variables, types, functions and methods.
It is type-aware and workspace-aware. Workspace-aware means that while you can absolutely use gorename to rename local variables, which will have no effect on the code outside of a function or even a package, you can also use it to rename exported identifiers. In that case, gorename will check all packages in your GOPATH for uses of that identifier, and rename those uses as well.
Being type-aware, and generally smart, means that gorename will refuse to make changes that stop the code from compiling correctly. If changing an identifier would cause a naming conflict or a shadowing error, gorename will abort. In the same way, if renaming a method would stop a type from implementing an interface that it has to implement, gorename will abort. Renaming a method in an interface, however, will cause gorename to update all known implementations and uses of the interface.
It has to be noted that gorename is “as strong as a compiler”, which means that if a compiler is able to complain about a type error, gorename is able to deal with it, too (either by renaming even more identifiers, or by aborting). However, there are more dynamic ways of using interfaces which can only be checked at runtime, and gorename isn’t able to detect these cases (as it’s an undecidable problem). While it is very rare that renaming an identifier will cause code to break due to this, it is still required to validate the changes that gorename makes.
Support for go-mode is included with gorename, support for vim can be found in vim-go.
godepgraph 
Install with go get github.com/kisielk/godepgraph
Another handy utility is godepgraph, a tool for generating dependency graphs (in Graphviz format) for Go packages.
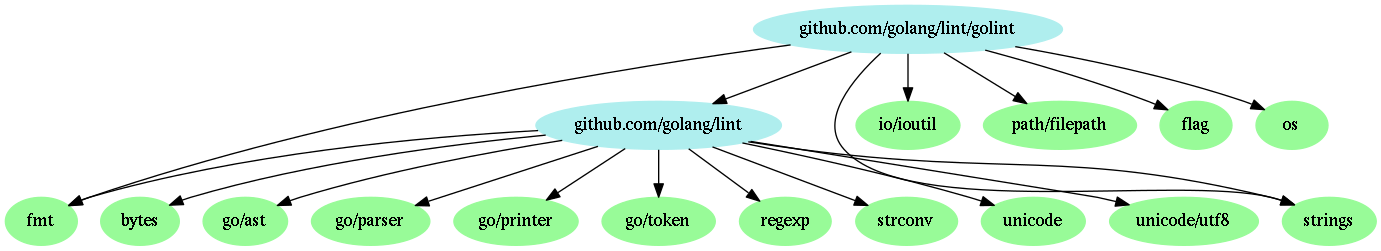
Figure 1: Dependency graph of golint, rendered with dot
Packages in the standard library are colored green, while packages from your GOPATH are colored blue. If a package
imports the pseudo package C, it will be colored orange, but C itself will not show up in the graph, as it isn’t a
real package. Also note how godepgraph doesn’t delve into the dependencies of the standard library, it only shows the
packages that are imported directly, and even those can be hidden with a command line flag.
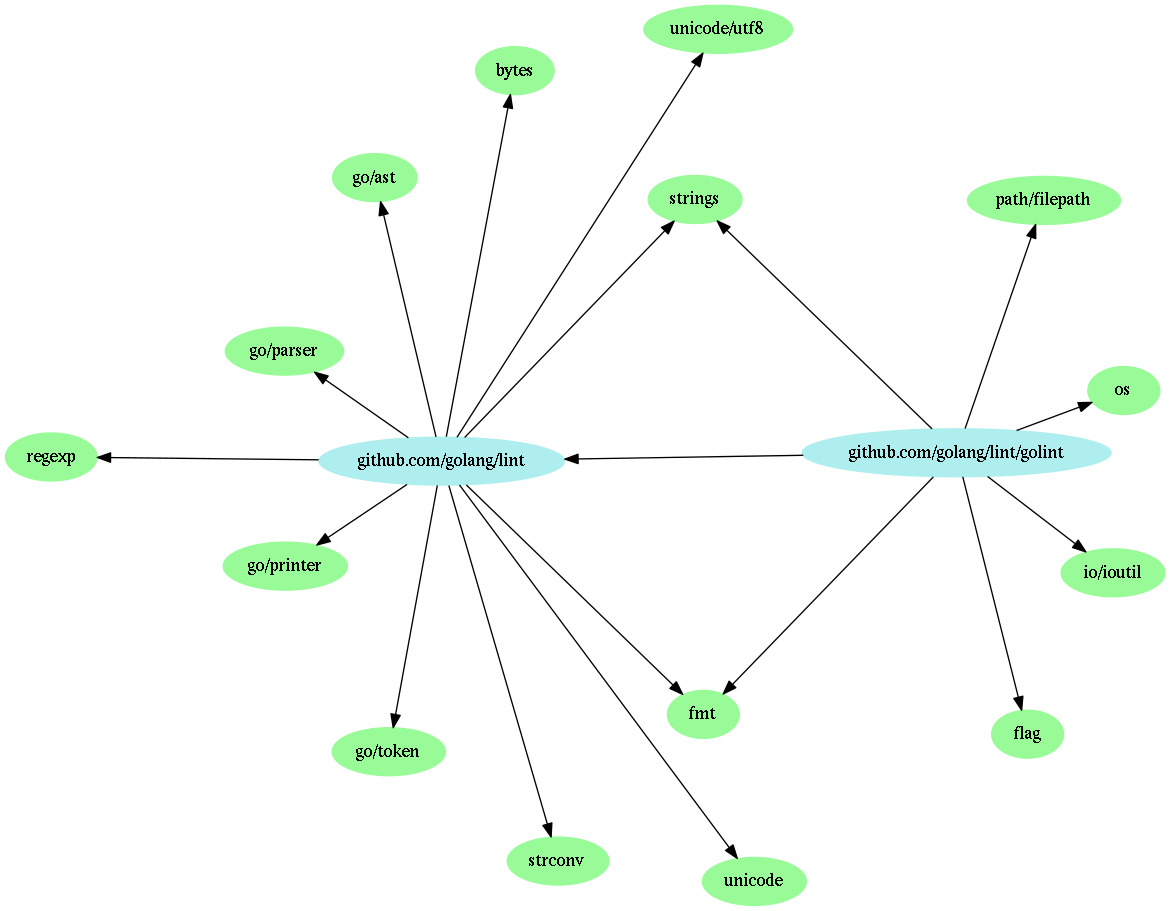
Figure 1: Dependency graph of golint, rendered with circo
Because godepgraph just outputs a directed graph in Graphviz format, you can tweak the final image in many ways: You can
use different Graphviz filters, such as dot or circo, and you can adjust all kinds of options affecting the layout. But
using dot and default settings usually works well enough – for small packages, anyway.